Hosting Kubernetes with a provider like Google Cloud Platform or Amazon Web services offloads a lot of management for Kubernetes administrators. One of the major benefits of hosted Kubernetes is automatic scalability, which almost all cloud platforms offer. In this blog post, we will cover the basics of configuring an auto scaling node pool in Google Kubernetes Engine. First, let’s get a basic understanding of the services involved.
Scaling Nodes
Vocabulary: nodes
- Node - A single compute instance in Kubernetes. Think of it as the actual machine that everything is running on, whether it be a bare metal or virtual server.
- Node Pool - A collection of one or more nodes together.
In Google Kubernetes Engine (GKE), instead of provisioning multiple virtual machines and assigning them to a node pool, you can just create an instance group (known as an autoscaling group in AWS) and set that as your node pool. Instance groups will automatically provision and deprovision virtual machines based on resource usage. This allows for a lot of flexibility with Kubernetes since pods are highly scalable as well. Deciding on the size of the nodes within the node pool takes a little more effort.
Scaling Pods
Vocabulary: pods
- Pod - A collection of one or more containers running together. Think of this as one level above a container, a collection of containers that has all the information needed to run on any platform.
- Horizontal Pod Autoscaler (HPA) - An API in Kubernetes that defines how and when a pod creates more replicas.
- Resources - Virtual computing resources such as CPU or memory.
- Pod Resource Utilization - The percentage of resources being used out of what is available on the pod.
Pods are at the heart of Kubernetes. The same way that a node is the smallest compute instance, a pod is the smallest process instance. Pods are made up of one or more containers and instructions on how to run those containers. All of that together creates a pod which is a fully functioning micro service. Kubernetes uses pods because they are very mobile and can be deployed on top of any node as long as there are resources available.
Before digging into scaling pods, it is helpful to understand how nodes and pods interact. Pods run your app’s containers on top of your nodes. Both nodes and pods have memory limits. The interplay in memory limits will tell Kubernetes how many pods can be run on a single node. For example, if your nodes are machines with 10GB memory, and your pods have memory limits of 5GB, Kubernetes will run two pods on each node. If your pods have 2.5GB limits, a single node will run four pods, etc.
In this post we will be setting up autoscaling for pods based on some thresholds. Because we have instance groups (or AWS autoscaling groups) set up that scale nodes on resource usage, when more pods are added, Kubernetes will implicitly scale nodes along with the pods. For example, with 10GB nodes and 5GB pods, if you scale to three pods, Kubernetes will run two nodes. Scale to four pods, Kubernetes will still run two nodes; when you have five pods, kubernetes will spin up an additional node to handle the fifth pod.
Kubernetes has a built-in method for scaling pods called the horizontal pod autoscaler (HPA). The HPA will increase the number of pods based on certain metrics defined by the administrator in the HPA manifest file. The most widely used metrics to scale by are CPU and memory average utilization. This is measured by taking the mean utilization of all pods running the service. In the manifest below, you can see we have set our HPA to increase the number of pods if our average CPU utilization is above 60%.
apiVersion: autoscaling/v2beta2
kind: HorizontalPodAutoscaler
metadata:
  name: nginx-hpa
spec:
  scaleTargetRef:
    apiVersion: apps/v1
    kind: Deployment
    name: nginx-deployment
  minReplicas: 4
  maxReplicas: 10
  metrics:
    - type: Resource
      resource:
        name: cpu
        target:
          type: Utilization
          averageUtilization: 60
Note: Kubernetes does have a Vertical Pod Autoscaler which scales over a long period of time, adjusting the resource requests and limits based on a set of metrics. This is a separate topic to be discussed and is not covered in this post.
Resource Requests and Limits
Vocabulary: resources
- Resource Requests - The guaranteed resources given to a pod. If there is no node with the resources to meet the resource request, the pod is not deployed until a new node is available.
- Resource Limit - The maximum resources a pod can use before being throttled or restarted. If the CPU is being used beyond the limit, it will get throttled down. However, passing the limit for memory and any other resources will trigger a restart of the pod.
- Realistic Load - The high point of traffic you can expect on a regular basis, such as a weekly high point.
- Breaking Point Load - An extreme load that may or may not ever happen, but will lead to the service crashing.
Resource requests and limits are used to prevent pods from hoarding all the resources of a node. Since the resource request defines what a pod is expected to have at startup, a pod cannot be deployed to a node that does not have that many resources available. Resource requests are also used by the metrics service to calculate the resource utilization as we mentioned earlier. Resource requests and limits are defined in the deployment manifest and set at the container level as seen below.
apiVersion: apps/v1
kind: Deployment
metadata:
  name: nginx-deployment
spec:
  selector:
    matchLabels:
      app: nginx
  replicas: 1
  template:
    metadata:
      labels:
        app: nginx
    spec:
      containers:
        - name: nginx
          image: nginx:1.7.9
          ports:
            - name: http
              containerPort: 80
          resources:
            requests:
              memory: 6Gi # This pod will not be deployed unless a node has 6GB of memory available
              cpu: 1
            limits:
              memory: 9Gi # If this pod exceeds using 9GB of memory, it will restart
              cpu: 1.5
Now that the basics are covered, let’s start by baselining our service. In GKE, you can view usage metrics at several levels, including the node level, the service level (all the pods running the same application), and the pod level. In order to baseline our service, we will dig into pod level metrics. If you are also using GCP, you can go to the dashboard, and then open up Kubernetes Engine > Workloads > select the name of the service you are trying to baseline > select any pod from this list.
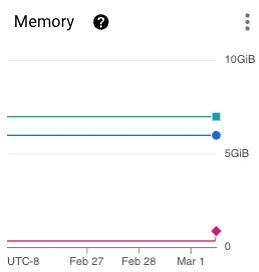
For this example, let’s just focus on memory. Looking at this pod over the past four days, it would seem that we are greatly over allocating memory. We use less than 0.5GB of memory, but have a requested 6GB! Although this seems like a mistake, it’s important to remember that we allocate resources for our service under load, not at baseline. This is because pods take time to spin up, and even though that process is only seconds, it is still enough time for pods to crash and throw errors.
Let’s now run a load test and see the memory consumption under a realistic load. The test you use here can be a custom script or using a tool like K6 or JMeter. We have a custom script that we use which we can define the number of parallel requests coming through. Keep your monitoring tool open so you can see the resources needed to handle this increased load.
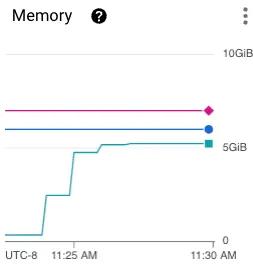
These metrics make it clear that our application uses around 5.5GB of memory under load. This is the situation we want to allocate resources for. In the case of a heavy spike in traffic, we want to be sure that our running services can handle it. In our case, that means our resource request for memory should be 6GB so that we know every single pod can handle a loaded system.
Above the resource request line, we can see the resource limit line. This line should never be crossed by memory since it will result in an immediate restart of that pod. To identify the resource limit, you should monitor a pod at breaking point load. Once you know the resource consumption of your application where it can no longer run, this will be your resource limit. As seen in the graph above, our pod plateaus at 5.5GB so we can be confident that 9GB of memory will never be reached. The resource limit is a bit hard to pin down, but since the resources past the resource request aren’t guaranteed, this pod can still be scheduled and won’t hog resources from other pods. After some time the limit may become more clear, but the main purpose is to set it to something that won’t be hit unless there is a catastrophic failure.
Configuring HPA
Again using the metrics graph from above, we can see the clear increase in memory consumption as the load begins. This is the information we need to configure the HPA. The question to answer here is “At what point is it possible there’s going to be a heavy load?” - looking at our graph, that’s probably around 3.5GB of memory consumed (60% of the resource request). Now in our HPA manifest file, we will set the average utilization target to 60%. This tells the Kubernetes cluster to scale up the number of pods if we ever see 60% of the resource request being consumed.
Configuring the Node Pool
Now that everything else is in place, it’s actually just a matter of doing some math. A best practice for any system is to avoid a single point of failure, which in this case means never having less than two nodes running. That way pods are split across multiple nodes, so if either node crashes, the service remains running.
Like our pods, we want our nodes to be allocated for load. Knowing that our pod’s memory request is 6GB, and we have our HPA set to a minimum of four pods, we want one node to have 12GB of memory. We will bump this up to 14GB to account for kube-system pods that are required for the Kubernetes cluster as well as the chance that we pass the memory request. So if we have a node with 14GB of memory, and a pod is only deployed if there is 6GB of memory available, we know that each node would only have 4GB of memory available if two pods are running. This forces any new pods to be deployed onto a different node. We also know that our HPA has a maximum of 10 pods, so considering our nodes are able to handle two pods each, we want the node pool to be able to scale up to five nodes.
TL;DR
And that’s basically it! To recap some of the major points:
- Use load tests to identify your pod’s resource requirements.
- Resource requests should be set to your pod’s requirements under average load.
- Resource limits should never be reached unless there is a complete failure.
- HPA thresholds are proactive and should be set to scale up before there is a heavy load.
- There should be a minimum of two nodes. Size each node to support no more than half the minimum in your HPA manifest. This prevents a single point of failure.
With proper load testing, setting the proper resource requests and limits is simple. Once request and limits are understood, configuring an HPA is straightforward. Once you have the HPA, selecting your node and node pool size is basic math. Using the tips from this post, you should now be able to optimize your Kubernetes cluster!