Night sweats
It’s sometime after midnight and you toss and turn. In your slumber, you are dreaming about getting a Slack alert that your production app is on fire from a random burst of traffic. After further inspection, you notice that one of your services seems to be having issues. You suspect this is due to some backpressure being created by read/write contentions in a shared queue... or any of a million other things. Every second spent trying to get your staging environment or PR deployment running with repro scenarios is a potential second of downtime for your service.
Gasp! You wake up. Now you get to thinking: 🎶Wouldn’t it be nice🎶 if you could quickly bring up a few instances of your microservice locally and try some suspect edge cases out?
Luckily, there is a quick and easy way to get set up to extend your docker-compose.yml with minimal impact to your workflow, allowing you to scale your services and load balance gRPC requests.
In this post, we will cover:
- how to use
docker-composeto scale a gRPC service - how to use NGINX as a gRPC proxy and load-balancer
- how to inspect your running containers
Introduction
While using RESTful APIs is a great way to expose services externally in a human readable way, there are a number of reasons why this may not be the best option for your internal services. One alternative is to use Remote Procedure Calls (gRPC) for this inter-service communication. Some advantages of this are:
- you define your message format and service calls using Protocol Buffers, which serve as contracts between clients and servers
- binary message format optimized to reduce bandwidth
- leverages modern HTTP2 for communication
- supports bi-directional streaming connections
- both clients and servers have the perk of interoperability across languages
If this seems like something that would suit your needs, here’s a helpful resource which provides great walkthroughs of setting up a client and server in several languages. For this post we’ll be using Node.js by extending a starter example from the gRPC repo.
Is this for me?
So let’s say you already have a microservice using gRPC, or maybe you don’t and want to learn how to make one. You run a containerized workflow using Docker Compose for your dev environment. Maybe you are running many instances of your microservice in production already through Docker Swarm, Kubernetes, or some other orchestration tool.
How would you go about replicating this configuration locally? Well ideally you could try to match up your local with what you have in production by using something like minikube or Docker Desktop with Kubernetes support (or others), but what if this is not an option or you need to get something up and running quickly to test out a new feature or hotfix? The rest of this post will cover how to get set up to do just that, providing examples along the way.
The sample project
Make a gRPC service
If you already have a service that uses gRPC you can follow along on how to change your docker-compose.yml to get up and running. If you don’t, you can use our provided example for inspiration. Either way, you can go ahead and clone the repo to follow along:
git clone https://github.com/anvilco/grpc-lb-example.git
Running the code
Everything you need is in our example repo and is run with three commands.
Open three separate terminal windows.
-
In one, start the server (this will build the images for you as well).
docker compose up --scale grpc=4 -
In another, monitor the container metrics.
docker stats -
Once the servers and proxy are up, run the client in another terminal.
docker compose run --rm grpc ./src/client.js --target nginx:50052 --iterations 10000 --batchSize 100
That’s it! Did you notice in the container metrics that all your servers were being used? That seems easy, but let’s take a look at how we did this.
Reviewing the project
Directory structure
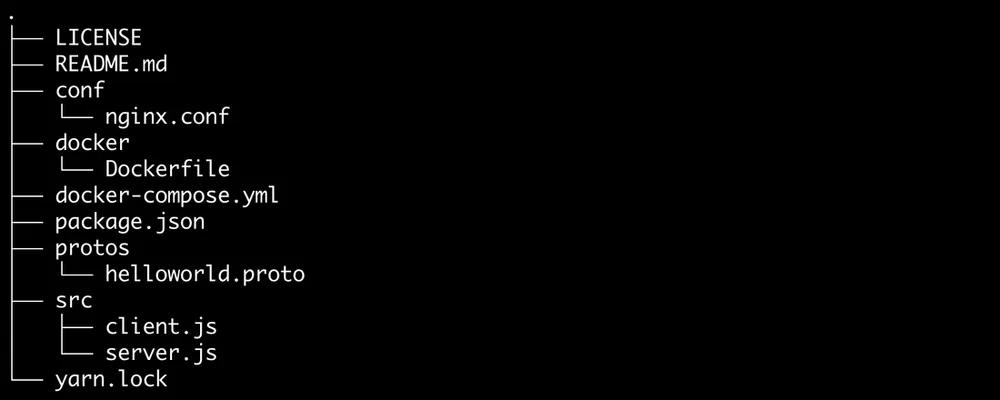
The project directory structure breaks out a few things:
src/- contains both the client and the server codeprotos/- the protocol buffer files used to define the gRPC messages and servicesconf/- the NGINX configuration file needed to proxy and LB the gRPC requestsdocker/- the Dockerfile used to run both the client and the server appsdocker-compose.yml- defines the docker services we will needpackage.json- defines the project dependencies for the client and the server

The dependencies for this project are in the package.json. These allow us to ingest the service and message definition in the protobuf and run the server and the client.
{
  "name": "grpc-lb-example",
  "version": "0.0.0",
  "dependencies": {
    "@grpc/grpc-js": "^1.3.1",
    "@grpc/proto-loader": "^0.6.2",
    "async": "^3.2.0",
    "google-protobuf": "^3.17.0",
    "minimist": "^1.2.5"
  }
}
We are using a node image to install the dependencies and run the server or client code in a container. The Dockerfile for this looks like:
FROM node:16
COPY . /home/node/
WORKDIR /home/node
RUN yarn install
USER node
ENTRYPOINT [ "node" ]
For the client and server, we use the gRPC project Node.js example with some modifications to suit us. We will get into details on these later.
The NGINX proxy config looks like:
user nginx;
events {
 worker_connections 1000;
}
http {
 upstream grpc_server {
   server grpc:50051;
 }
 server {
   listen 50052 http2;
   location / {
     grpc_pass grpc://grpc_server;
   }
 }
}
The main things that are happening here are that we are defining NGINX to listen on port 50052 and proxy this HTTP2 traffic to our gRPC server defined as grpc_server. NGINX figures out that this serviceName:port combo resolves to more than one instance through Docker DNS. By default, NGINX will round robin over these servers as the requests come in. There is a way to set the load-balancing behavior to do other things, which you can learn about more in the comments of the repo.
We create three services through our docker-compose.yml
grpc- runs the servernginx- runs the proxy to ourgrpcservicecAdvisor- gives us a GUI in the browser to inspect our containers
version: '3.9'

services:
 grpc:
    image: grpc_lb
    build:
      context: .
      dockerfile: docker/Dockerfile
    volumes:
      - ./src:/home/node/src:ro
    ports:
      - "50051"
    command: ./src/server.js

  nginx:
    image: nginx:1.20.0
    container_name: nginx
    ports:
      - "50052:50052"
    depends_on:
      - grpc
    volumes:
      - ./conf/nginx.conf:/etc/nginx/nginx.conf:ro

  cAdvisor:
    ...<leaving out for brevity>
Scaling your service
This section is especially important if you already have a gRPC service and are trying to replicate the functionality from this example repo. There are a few notable things that need to happen in your docker-compose.yml file.
Let your containers grow
Make sure you remove any container_name from a service you want to scale, otherwise you will get a warning.

This is important because docker will need to name your containers individually when you want to have more than one of them running.
Don’t port clash
We need to make sure that if you are mapping ports, you use the correct format. The standard host port mapping in short syntax is HOST:CONTAINER which will lead to port clashes when you attempt to spin up more than one container. We will use ephemeral host ports instead.
Instead of:
   ports:
     - "50051:50051"
Do this:
   ports:
     - "50051"
Doing it this way, Docker will auto-”magic”-ly grab unused ports from the host to map to the container and you won’t know what these are ahead of time. You can see what they ended up being after you bring your service up:

Get the proxy hooked up
Using the nginx service in docker-compose.yml plus the nginx.conf should be all you need here. Just make sure that you replace the grpc:50051 with your service’s name and port if it is different from the example.
Bring it up
After working through the things outlined above, to start your proxy and service up with a certain number of instances you just need to pass an additional argument --scale <serviceName>:<number of instances>.
docker-compose up --scale grpc=4
Normally this would require us to first spin up the scaled instances, check what ports get used, and add those ports to a connection pool list for our client. But we can take advantage of both NGINX proxy and Docker’s built-in DNS to reference the serviceName:port to get both DNS and load balancing to all the containers for that service. Yay!
If all is working, you will see logs from nginx service when you run the client:

Some highlights about the example code
Let’s call out some things we did in the example code that may be important for you. A good bit of syntax was changed to align with our own preferences, so here we mention the actual functionality changes.
server.js
This is mostly the same as the original example except that we added a random ID to attach to each server so we could see in the reponses. We also added an additional service call.
/**
 * Create a random ID for each server
 */
const id = crypto.randomBytes(5).toString('hex')

// New service call
function sayGoodbye(call, callback) {
  callback(null, {
    message: 'See you next time ' + call.request.name + ' from ' + id,
  })
}
helloworld.proto
Here we added another service and renamed the messages slightly.
// The service definitions.
service Greeter {
 rpc SayHello (Request) returns (Reply) {}
 rpc SayGoodbye (Request) returns (Reply) {}
}
client.js
This is where we changed a lot of things. In broad strokes we:
-
Collect the unique serverIDs that respond to us to log after all requests.
const serversVisited = new Set(); <...> serversVisited.add(message.split(' ').pop()); <...> console.log('serversVisited', Array.from(serversVisited)) -
Promisify the client function calls to let us
awaitthem and avoid callback hell.const sayHello = promisify(client.sayHello).bind(client) const sayGoodbye = promisify(client.sayGoodbye).bind(client) -
Perform batching so we send off a chunk of requests at a time, delay for some time, then second another chunk off until we burn through all our desired iterations.
- Here you can play with the
batchSizeanditerationsarguments to test out where your service blows up in latency, throughput, or anything else you are monitoring like CPU or memory utilization.
// Handles the batching behavior we want const numberOfBatchesToRun = Math.round(iterations / batchSize) timesSeries( numberOfBatchesToRun, // function to run for `numberOfBatchesToRun` times in series (__, next) => times(batchSize, fnToRunInBatches, next), // function to run after all our requests are done () => console.log('serversVisited', Array.from(serversVisited)) ) - Here you can play with the
Inspecting containers
You can use the handy command docker stats to get a view in your terminal of your containers. This is a nice and quick way to see the running containers’ CPU, memory, and network utilization, but it shows you these live with no history view.

Alternatively, we provide a service in the docker-compose.yml that spins up a container running cAdvisor, which offers a GUI around these same useful metrics with user-friendly graphs.
If you would rather run this as a one off container instead of a service, remove the service cAdvisor and run this command in another terminal session instead (tested on macOS):
docker run \
--rm \
--volume=/:/rootfs:ro \
--volume=/var/run/docker.sock:/var/run/docker.sock:ro \
--volume=/sys:/sys:ro \
--volume=/var/lib/docker/:/var/lib/docker:ro \
--volume=/dev/disk/:/dev/disk:ro \
--publish=3003:8080 \
--detach=true \
--name=cadvisor \
--privileged \
--device=/dev/kmsg \
--userns=host \
gcr.io/cadvisor/cadvisor:latest
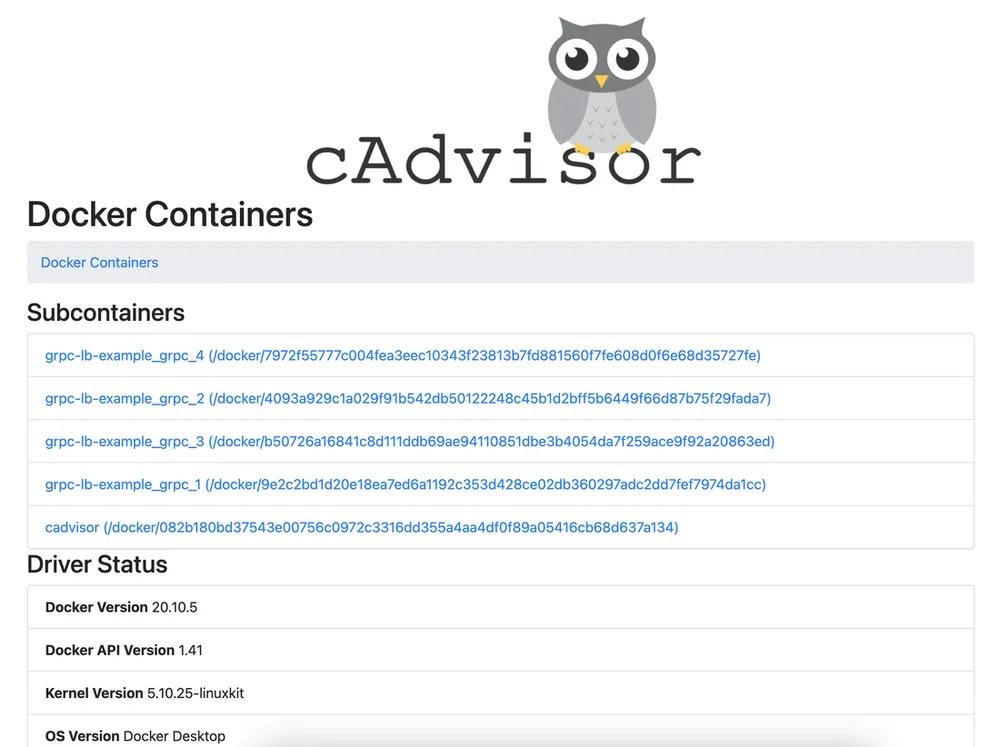
Now open a browser and go to http://localhost:3003/docker/ to see the list of containers. It should look like:

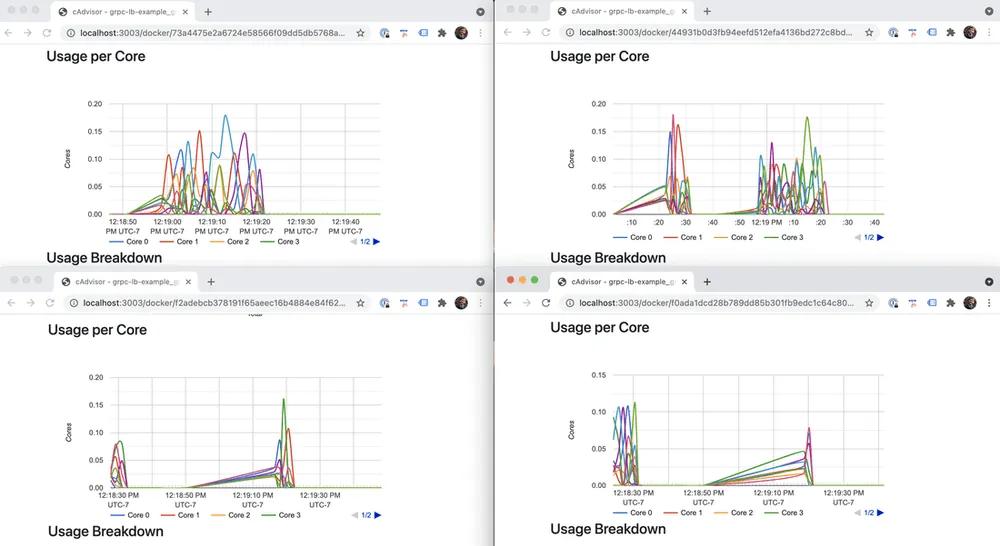
Here is a view of all four of the instances of my grpc service in action. You can see they all share the load during the client requests. Without load-balancing, only a single instance would get all the traffic, bummer.

Watching for errors
Now may be a good time for you to start tweaking the arguments to your client and seeing how this impacts your service. If you end up overwhelming it, you will start to see things like:

This is when you know to start honing in on problem areas depending on what types of errors you are seeing.
Summary
In this post we have covered how to use Docker Compose to scale a service locally. This allows us to leverage NGINX as a proxy with load-balancing capabilities and Docker’s own DNS to run multiple instances of a gRPC service. We also looked at how to inspect our running containers using docker stats and cAdvisor. No more night sweats for you!
If you enjoyed this post and want to read more about a particular topic, like using Traefik instead of NGINX, we’d love to hear from you! Let us know at developers@useanvil.com.


