With a complex web application, there are a lot of things to monitor to make sure that everything is running smoothly: CPU utilization, memory utilization, disk IO, requests per minute, error rates, database connections, and average query durations, just to name a few. If any of these get outside of acceptable limits, your application can slow down or even crash. The causes behind each of the above mentioned symptoms can be very different, so the process of diagnosing and fixing any one of them needs to be tailored to the particular problem you're encountering. A while back, we noticed that our Node web application servers had a slow memory leak and we wanted to fix it. In this blog post, I'm going to outline the process of tracking down the leak and fixing it.
Wikipedia defines a memory leak as "a type of resource leak that occurs when a computer program incorrectly manages memory allocations in a way that memory which is no longer needed is not released." This usually means that as a process with a memory leak continues to run, the memory that it is using will continue to grow. Our application monitoring showed that our main web application process was suffering from this. Memory allocation cannot grow infinitely, and eventually the process will encounter an "out of memory" fault or exception, and it will crash or be terminated. This is obviously bad for your application, and unless you are restarting your processes regularly (as we had to do intentionally for a while to keep the application healthy) you are going to have issues.
Tools We Could Use
But how do you isolate a memory leak in Node? Here are a few options:
- Cross reference the major increases in application memory with the areas of your application that are getting the most usage during those times. Depending on the type of monitoring you've set up on your application, this may be trivial or it may be extremely difficult or impossible. Either way, it's also not guaranteed to lead you to the exact culprit, but may point you in the right direction.
- Use a 3rd party package like
heapdumpornode-inspectorto help monitor and provide insight into your application's memory usage and growth. There was a time when these packages were probably your best option, however that time has passed (see option 3). - Use built-in tools provided by the Node.js binary, such as debug mode, or the
v8.getHeapSnapshot(). The Node team has been continually improving the built-in developer experience and this suite of tools are extremely useful - especially for finding a memory leak.
Getting The Data We Need
In modern versions of Node, option 3 is by far the best option so we decided to go that route. The included Node developer tools are great, and I encourage readers to check out a few articles (like this one, this one, or this one) about how to use them to find memory leaks. While those articles are great, all of the examples I've seen are also a bit oversimplified. Small, contrived example code is not super helpful and it leaves out a lot of the challenges of debugging a production issue using these tools. Here are few challenges that you're likely to encounter in a real production environment:
- Exposing the debugger port on your production environment is a big security risk. Bad actors that gain access to it would be able to see your code and execute arbitrary code on your production machine. No bueno. This can be mitigated by having the proper port isolation, firewalls and/or VPN access put in place, but this is cumbersome at best and still risky if you mess something up at worst. We didn't want to do this.
- There is additional "overhead" associated with running the Node process in debugger mode.
- Performing a "timeline" approach to get your heap information may require you to stay connected to your server for hours waiting for a noticeable change in the memory footprint to occur. In the meantime if you lose connectivity, you will have to start over again.
- Other approaches like dumping the heap snapshot have some significant overhead as well. The docs for
v8.getHeapSnapshot()say it "requires memory about twice the size of the heap at the time the snapshot is created. This results in the risk of OOM killers terminating the process." And "generating a snapshot is a synchronous operation which blocks the event loop for a duration depending on the heap size." These are some pretty bad things to have going on in your production environment.
I think that it's clear now that trying to access the necessary debugger information directly from production has some downsides that outweigh the benefits. OK, well what about debugging from your local environment?
- While we use docker-compose to mimic our production environment somewhat closely in our local kits, there are certain parts of the stack and application that are just not going to be comparable across the two environments. For example, some services are simplified, made synchronous or non-concurrent, or even spoofed/stubbed on our local kits. What if the leak was in one of those areas that was not properly represented on our locals? Then we'd never find the leak.
- There is still a problem of causing a significant amount of actions to your application to trigger the leak in a way where it should be obvious to find.
Fortunately at Anvil, we had a third option: staging. Our staging environment turned out to be an ideal environment to get the data we needed for a few reasons:
- It runs on pretty much the same infrastructure as production with the same complexities regarding load balancing, k8s, etc., so it was very likely that whatever code that was causing the leak in production would also cause the leak on staging.
- Throwing a large amount of artificial traffic at it to simulate users would accelerate the leak size while not slowing things down for real users.
- We could turn off health checks that would otherwise have caused the instances to restart when they became sluggish or unresponsive.
- It's not production, so it's OK if it halts for periods of time during snapshots or accidentally goes down during the process.
I should say right now that I realize that not everyone will be so fortunate to have a way to throw a high amount of artificial traffic at their application. If you are one of these people, you can see a suggestion at the end of this post.1
We set up an image to dump a heap snapshot to a shared disk every 10 minutes or so. Then we put that image up on staging, threw a bunch of traffic at it, watched the memory climb and persist there (so we knew we had triggered the leak), and then collected all the heap snapshot dumps. Great!
Analysis
We should now have all the information we need to isolate the memory leak. Let's get to it:
- Open up Chrome and browse to
chrome://inspect - Click on the
Open dedicated DevTools for Node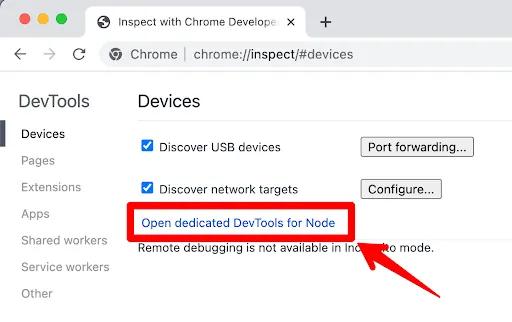
- In the window that pops up, choose the
Memorytab and then load 2 of the snapshot dumps - preferably the last one and one in the middle of the samples somewhere.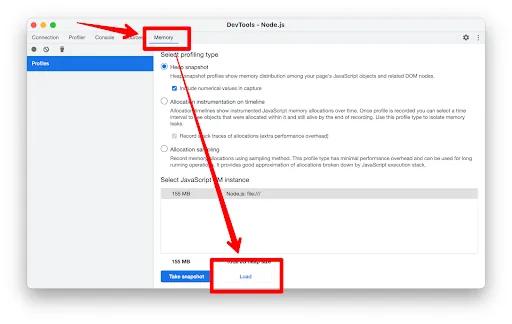
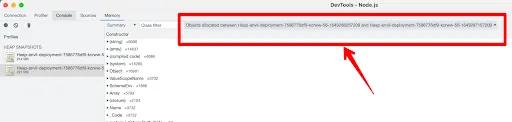
- Then, choose to only show objects that were created between 2 of the snapshots.
OK, now we're in a good spot to do some analysis and interpret the data we've collected. But it's definitely "part art, part science". Here's a walkthrough of how we figured out what was going on:
- The resulting diff will be grouped by the
Constructorand default sorted by theRetained Size, meaning it will show you the kinds of things that grew the most in between the 2 snapshots.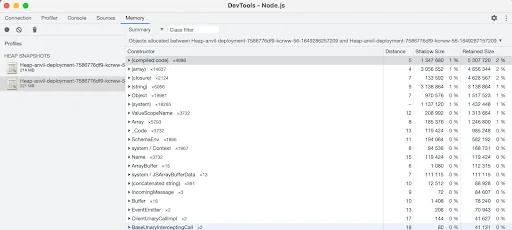
- It looks like the
compiled codeis a promising area to dig deeper. However, at first glance, all the objects we see are of sort of random sizes and parts of the code.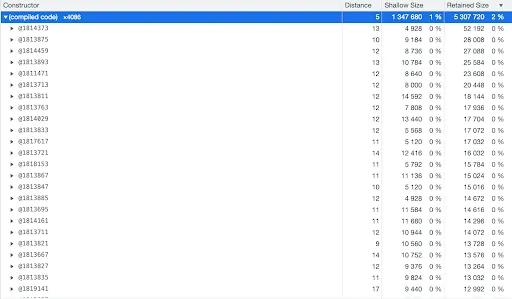
- But if we scroll down a while, we eventually get to rows and rows of identical allocations, all seemingly from
AJV, which is a library we use for schema validation. This is a big clue.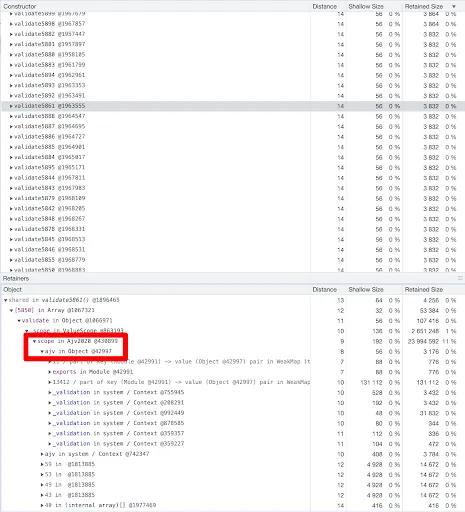
- A similar thing appears when we scroll down in the
arraygroup.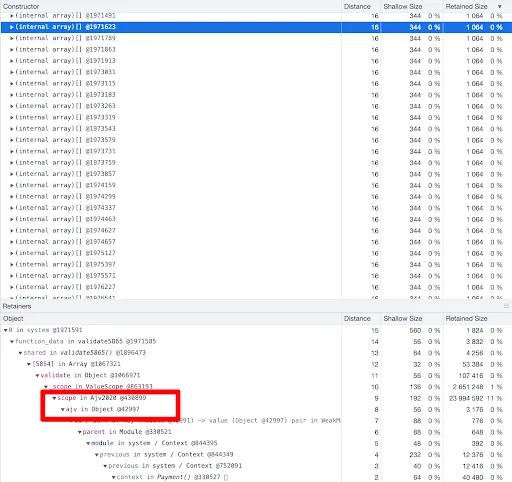
- And for
closures, we don't even have to scroll down to find tons of AJV allocations.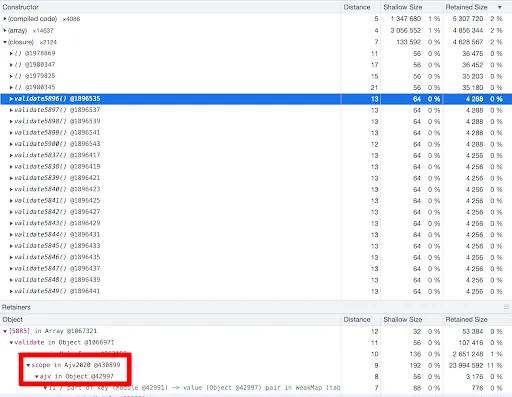
Conclusion
At this point it became clear that something to do with AJV was responsible for the memory leak. A quick search revealed issues and articles discussing some unexpected behavior of the library that could lead to memory-leak-like behavior. We then were able to refactor things and fix the leak, and now our instances don't need to be restarted regularly to keep from crashing. Nice!
As I've illustrated, while many articles out there describe how to debug and identify a memory leak in a simple, contrived Node.js application, doing so in a complex, production application is not so straightforward or well documented. I hope this article helped provide some insight into how to debug and isolate a memory leak in a real-world application if you ever find yourself needing to fix one. Happy coding!
Footnotes
-
I suppose the approach I would have tried was:
- Have the new production servers warm-up for a short period of time before writing a heap snapshot to a shared or local disk. This would serve as the baseline snapshot.
- After the snapshot is written, add that server to your pool or expose it to the outside world so it can start handling traffic.
- Let the server run and develop the memory leak.
- Pull the server from the pool, SSH into it and trigger a 2nd heap snapshot via a local HTTP call.
- Download the snapshots from the shared or local disk.
- Yeah, not easy, either…but engineering is hard.