

Time to talk about everyone’s favorite topic, testing! Now, I know testing isn’t the most exciting thing in the world, but that doesn’t mean it isn’t important. In fact, load testing is probably the single most important step in ensuring a resilient application. Load testing is simply putting demand on a system and measuring its response. How the demand is applied, what the demand is, how much demand is applied, and the measurements taken from the system being loaded, are all up to the configuration of the load testing framework.
If you’re deployed on Kubernetes, you may think your horizontal pod autoscaler will handle scaling as traffic spikes, but what is it scaling based on? What happens if memory spikes on a pod that scales on CPU? Are your resource limits set accordingly? How long does it take to scale up? How is latency while scaling? The list goes on and on. As your application scales there are a lot of edge cases you’ll need to consider, so it is important to load your system in a controlled environment and be prepared for any spikes in usage.
Load test environment
Testing for all of this is a lot easier said than done. Just like any other tests, you’ll want to mimic your production environment as closely as possible. But unlike something like unit tests, the infrastructure will play a major part in performance at scale. We can’t run load tests against the live production environment because the quality of service will be greatly affected. A pre-production or staging environment could work, but in many cases there is different code deployed in these environments as well as different infrastructure.
There are a number of ways to address keeping environments almost identical. Tools like Helm and Kustomize offer the ability to package or template your application image along with its infrastructure for easy redeployment.
The first attempt
At Anvil, we decided to create an on-demand load testing environment leveraging Github Actions, Kustomize, and K6 (more on this later). On a release we trigger a load testing workflow in Github Actions which takes the production overlays, replaces some environment unique settings with Kustomize, creates a new database with seed data, and deploys everything into a new namespace in a non-production cluster. K6 is then executed as part of the workflow and once it’s finished the whole environment is torn down. This allows us to minimize drift and cost while running resource-heavy load tests.
This is all well and good, but there’s no point in building something if no one uses it. After a few releases we noticed that we didn’t care about the load test results unless something broke the thresholds. Even though we built this whole environment that was giving us accurate results, it felt like we weren’t taking full advantage of it.
This boiled down to lack of context. Tests were running on releases, and in the release workflow we could see the results as terminal output:
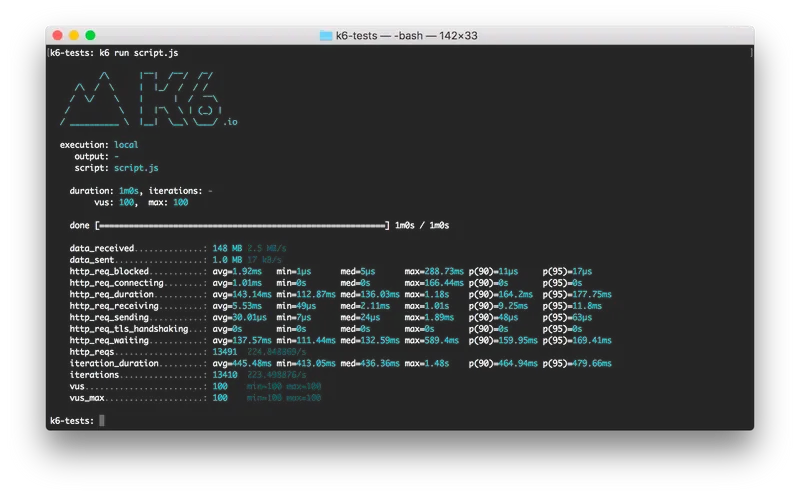
But this data was basically unusable. It could be downloaded as a text file and compared with other results by hand, but how could we actually track the progress of our application? Was there a way to persist this data in a way that would allow us to prove that our hard work was making a difference? Turns out, the answer was a resounding “YES”. Of course it took some work, but we found using InfluxDB and Grafana along with K6 gave us exactly what we wanted.
K6 image
Let’s talk a little bit more about these technologies before we dive into the implementation. The aforementioned K6 is a load testing tool which we really like because it is very mobile (aka easy to deploy locally or in automated workflow), all tests are written in JavaScript (easy for anyone to write and great customization), and it allows for exporting results to databases (for persistence). We use K6s official docker image and copy our test files onto it so we can deploy the container anywhere and run our tests. The image is stored alongside our application images.
FROM loadimpact/k6
WORKDIR /home/k6

RUN mkdir -p /home/k6/reports/k6

COPY test/load test/load
We won’t cover writing tests in K6 with this blog post as it is unique to every application and would be out of scope, but the official K6 documentation is a great place to start writing load tests.
InfluxDB and Grafana installation
InfluxDB is a time series database which means it has a timestamp for every single row. In classic relational databases this would be a waste of valuable storage and processing power, but time series databases are specialized for gathering metrics. If you have heard about Prometheus, this is another flavor of that.
Lastly, we have Grafana, which I’m sure most people that made it this far in the post are already aware of. Grafana is a dashboarding tool with countless features. It allows for using multiple types of datasources, creating dashboards from scratch, setting up alerts, and so much more.
Influx DB and Grafana play very well together, and both can be installed easily into a Kubernetes cluster using Helm. Once you are logged into your Kubernetes cluster, you can run the following.
# Create a benchmark namespace
kubectl create namespace benchmark
kubectl config set-context --current --namespace=benchmark

# Install Influx DB - https://github.com/influxdata/helm-charts/tree/master/charts/influxdb
# Be sure to install influxdb, not influxdb2. The new version does not work with our dashboard
helm repo add influxdata https://helm.influxdata.com
# Add a default database
helm upgrade --install influxdb \
  --set persistence.enabled=true,persistence.size=50Gi \
  --set "env[0].name=INFLUXDB_DB" \
  --set "env[0].value=k6" \
    influxdata/influxdb

# Install grafana - https://github.com/grafana/helm-charts/tree/main/charts/grafana
helm repo add grafana https://grafana.github.io/helm-charts
helm repo update
helm install grafana grafana/grafana
Grafana dashboard configuration
I recommend configuring your datasource and dashboard in a manifest file, but for the sake of time we will use Grafana’s UI to configure the rest! To access the dashboard you can port forward to the Grafana service:
kubectl port-forward --namespace benchmark service/grafana 3000:3000
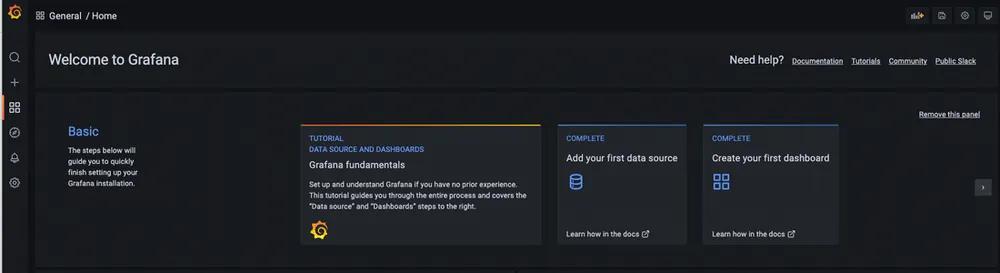
Leave this terminal open and go to localhost:3000 in your local browser. You should see a page like this.
On the left hand side, click the cog icon > Add data source > InfluxDB. Once you get to the configuration screen, fill out the following information:
URL: http://influxdb:8086
Database: k6
Click Save & test to confirm the setting and save the datasource.
Grafana can now read data from our instance of InfluxDB, but it doesn’t know how to display it. In order to display the data in a way that makes sense, we need to configure a dashboard. Configuring every metric and reading would take a long time, but luckily there is a preconfigured dashboard we like to use! We prefer this dashboard since we run our load tests using API endpoints. This dashboard breaks down response time and errors by endpoint and allows us to evaluate specific services.
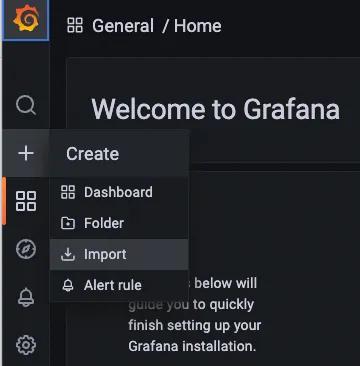
To import this dashboard, hover over the “+” on the left hand side and select “Import”.
In the “Import from grafana.com” field, enter 10660 and select Load. This is the ID for the dashboard mentioned above.
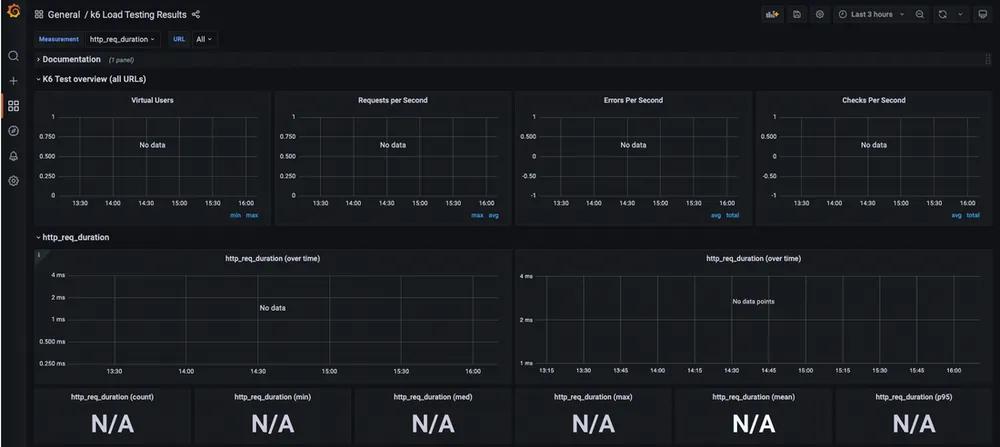
There is no data in the database yet so there is nothing to display. The good news is the hard part is done! All that's left is to run K6 and tell it to export the results to your new database. Grafana will parse that data and display it in these graphs.
Exporting K6 data
Exporting test results from K6 is fairly easy, just set the environment variable K6_OUT and run your tests. Again, we are assuming you are already running K6 and have a process for running your tests.
There is one complication to consider, K6 will need access to the InfluxDB instance which is deployed within the Kubernetes benchmark namespace. There are a few options to grant access here, you could:
- Run K6 on your local machine and port forward the instance of InfluxDB and set
K6_OUT=influxdb=localhost:8086 - Run K6 on your local machine and expose InfluxDB via ingress. Be sure to set a username and password here if you choose this option.
- Execute K6 from within your kubernetes cluster in whichever namespace your application is deployed in and set
K6_OUT=influxdb=influxdb.benchmark.svc.cluster.local:8086.
For security and automation reasons, we like option 3. With the environment variable set, all we need to do is execute K6 and we should start seeing our Grafana dashboard populate!
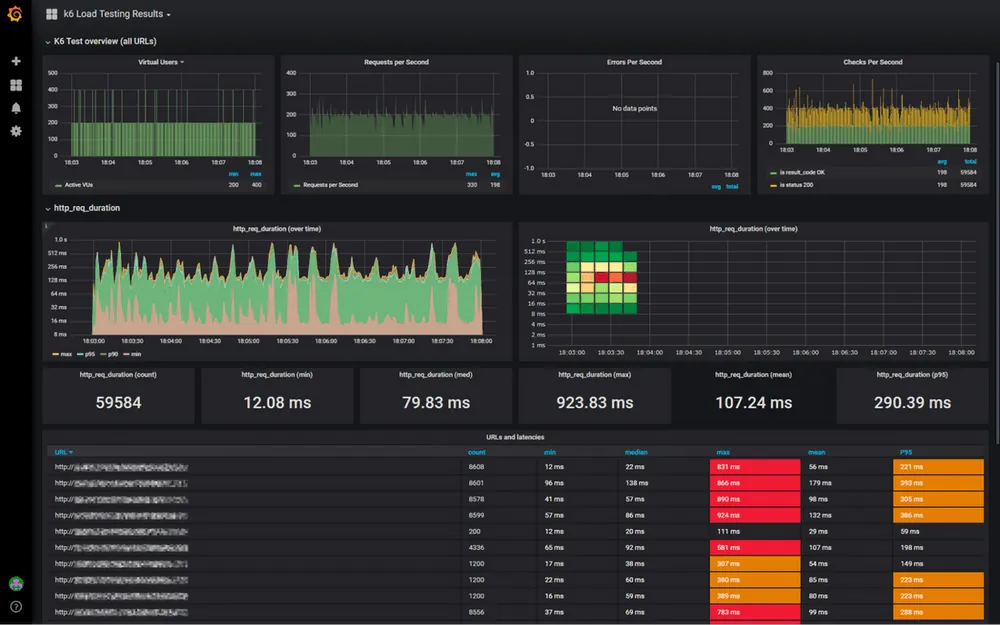
The "Errors per Second" panel needs some configuration
This dashboard is meant to work with K6 and breaks out the data very well. It can also be customized in a lot of different ways so play around with it and make it work for your test data.
Now you can load-test and compare metrics from previous tests! K6, InfluxDB, and Grafana are great tools to use if you are running an application in Kubernetes. They play nicely together and provide incredible insight into the performance and resilience of an application. We use this data to:
- Track release quality
- Track infrastructure quality
- Tweak pod autoscaling
- Tweak node sizing
- Break out resource intensive endpoints
If you load test your application (which you should be) and you are using K6, this is a great way to leverage all of its capabilities.